using ToMATo
import GeometricDatasets as gd
using AlgebraOfGraphics
using MakieExamples
Let’s play with some datasets and choices of the parameter \(\tau\) and the proximity graph \(g\).
Load some packages
Two normals in the plane
Define \(X\) as the union of two normal distributions
X = hcat(randn(2, 800), randn(2, 800) .+ 4)
k = x -> exp(-(x / 2)^2)
ds = gd.Filters.density(X, kernel_function = X -> X .|> k |> sum)

df = (x1 = X[1, :], x2 = X[2, :], ds = ds)
plt = data(df) * mapping(:x1, :x2, color = :ds)
draw(plt)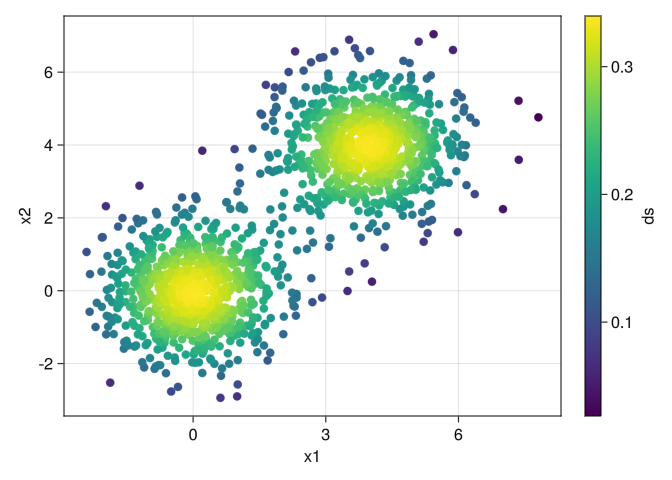
Create its proximity graph
g = proximity_graph(X, 0.2, max_k_ball = 6, k_nn = 4, min_k_ball = 2)

fig, ax, plt = graph_plot(X, g, ds)
fig
┌ Warning: Axis got passed, but also axis attributes. Ignoring axis attributes (type = Axis, width = 600, height = 600).
└ @ AlgebraOfGraphics ~/.julia/packages/AlgebraOfGraphics/yhdjr/src/draw.jl:19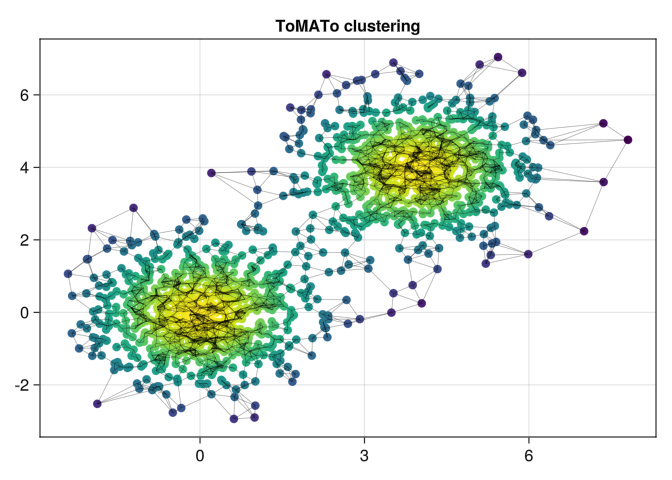
and plot its 0-dimensional persistence diagram
_clusters_, births_and_deaths = tomato(X, g, ds, Inf)
plot_births_and_deaths(births_and_deaths)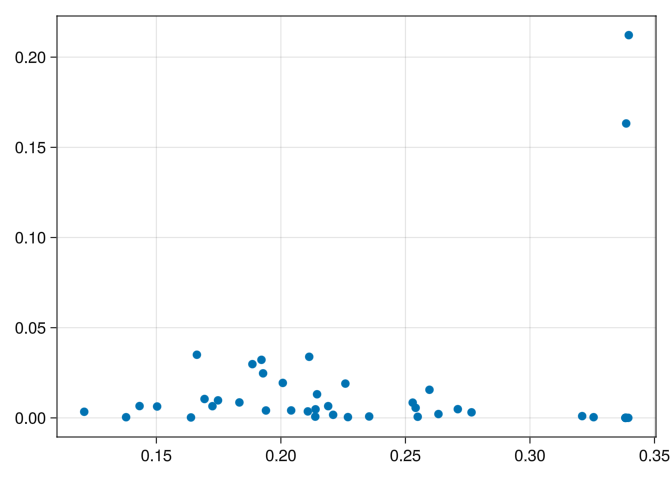
Setting \(\tau\) to 0.1 seems a good choice.
τ = 0.1
clusters, births_and_deaths = tomato(X, g, ds, τ, max_cluster_height = τ)

fig, ax, plt = graph_plot(X, g, clusters .|> string)
fig
┌ Warning: Axis got passed, but also axis attributes. Ignoring axis attributes (type = Axis, width = 600, height = 600).
└ @ AlgebraOfGraphics ~/.julia/packages/AlgebraOfGraphics/yhdjr/src/draw.jl:19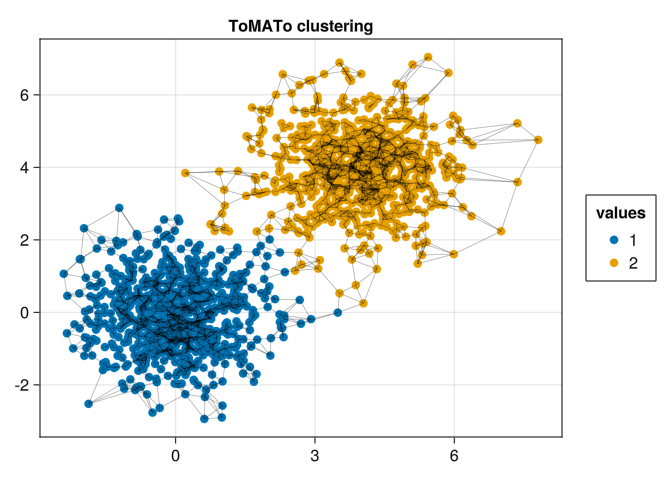
Three normals in the plane
X = hcat(randn(2, 500), randn(2, 500) .+ 4, randn(2, 600) .*0.8 .+ (-3, 3))
k = x -> exp(-(x)^2)
ds = gd.Filters.density(X, kernel_function = X -> X .|> k |> sum)

df = (x1 = X[1, :], x2 = X[2, :], ds = ds)
plt = data(df) * mapping(:x1, :x2, color = :ds)
draw(plt)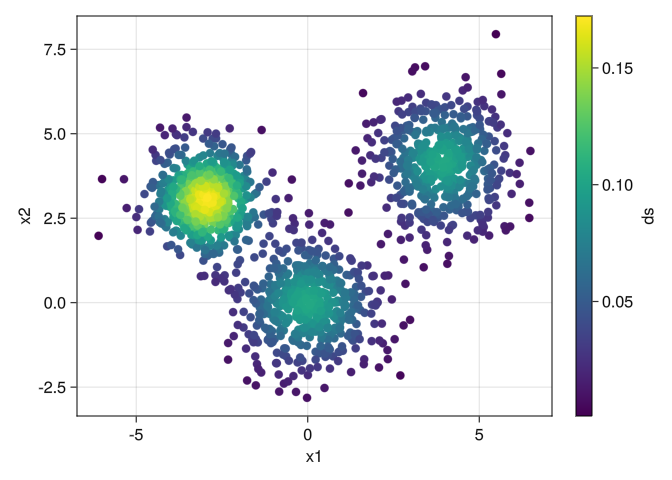
g = proximity_graph(X, 0.2, max_k_ball = 10, k_nn = 5, min_k_ball = 5)

fig, ax, plt = graph_plot(X, g, ds)
fig
┌ Warning: Axis got passed, but also axis attributes. Ignoring axis attributes (type = Axis, width = 600, height = 600).
└ @ AlgebraOfGraphics ~/.julia/packages/AlgebraOfGraphics/yhdjr/src/draw.jl:19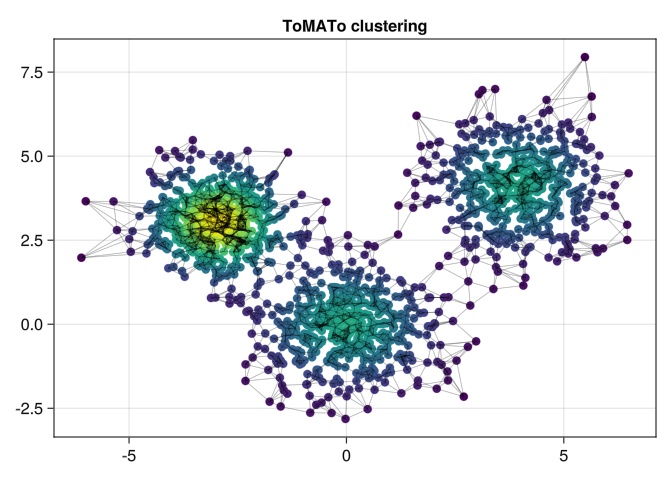
_, births_and_deaths = tomato(X, g, ds, Inf)
plot_births_and_deaths(births_and_deaths)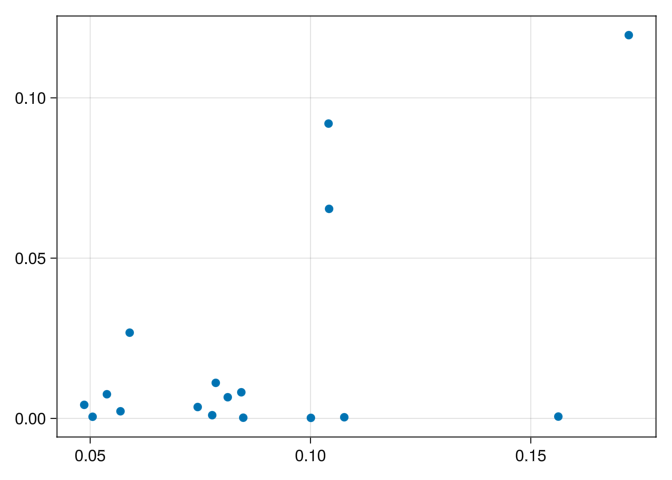
τ = 0.05
clusters, _ = tomato(X, g, ds, τ, max_cluster_height = τ)

fig, ax, plt = graph_plot(X, g, clusters .|> string)
fig
┌ Warning: Axis got passed, but also axis attributes. Ignoring axis attributes (type = Axis, width = 600, height = 600).
└ @ AlgebraOfGraphics ~/.julia/packages/AlgebraOfGraphics/yhdjr/src/draw.jl:19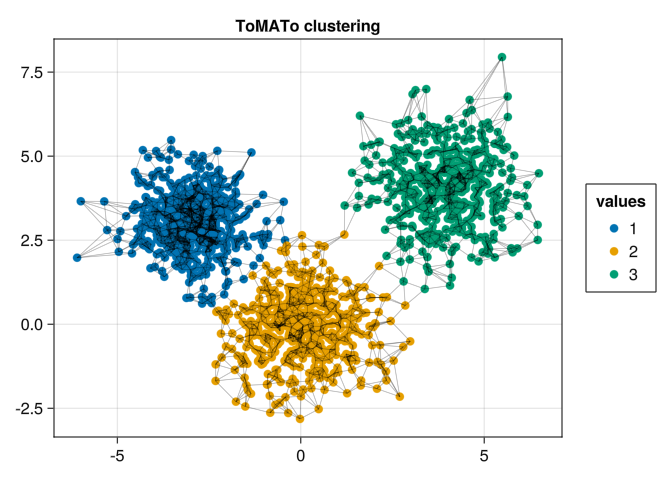
Two normals in \(\mathbb{R}^3\)
X = hcat(randn(3, 800), randn(3, 800) .+ 4)
k = x -> exp(-(x / 2)^2)
ds = gd.Filters.density(X, kernel_function = X -> X .|> k |> sum)

g = proximity_graph(X, 0.2, max_k_ball = 10, k_nn = 5, min_k_ball = 4)
fig, ax, plt = graph_plot(X, g, ds)
fig
┌ Warning: Axis got passed, but also axis attributes. Ignoring axis attributes (type = Axis3, width = 600, height = 600).
└ @ AlgebraOfGraphics ~/.julia/packages/AlgebraOfGraphics/yhdjr/src/draw.jl:19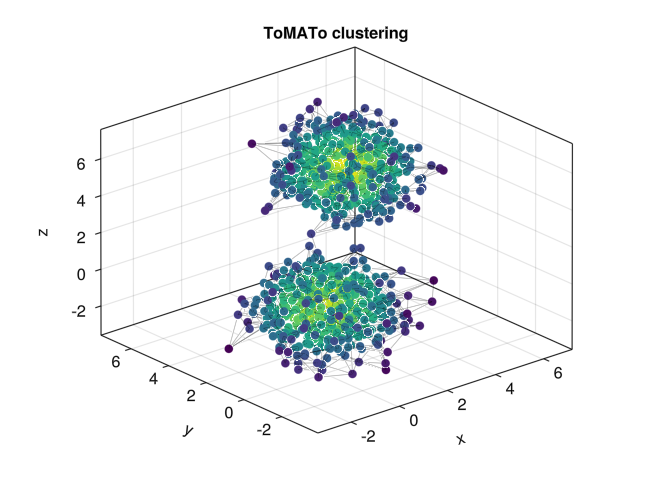
_, births_and_deaths = tomato(X, g, ds, Inf)
plot_births_and_deaths(births_and_deaths)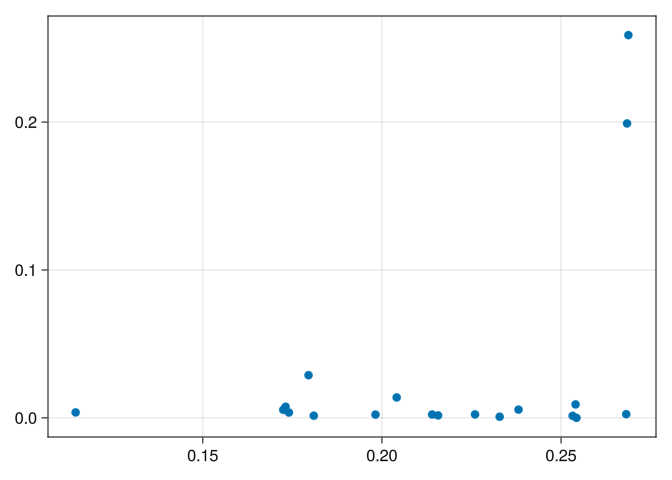
τ = 0.1
clusters, _ = tomato(X, g, ds, τ, max_cluster_height = τ)

fig, ax, plt = graph_plot(X, g, clusters .|> string)
fig
┌ Warning: Axis got passed, but also axis attributes. Ignoring axis attributes (type = Axis3, width = 600, height = 600).
└ @ AlgebraOfGraphics ~/.julia/packages/AlgebraOfGraphics/yhdjr/src/draw.jl:19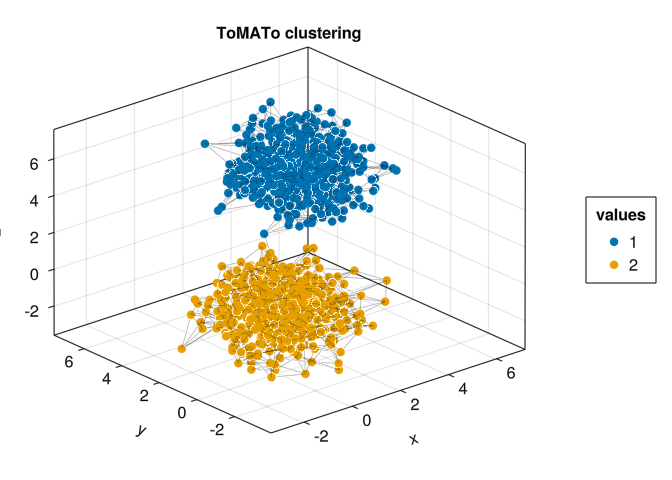
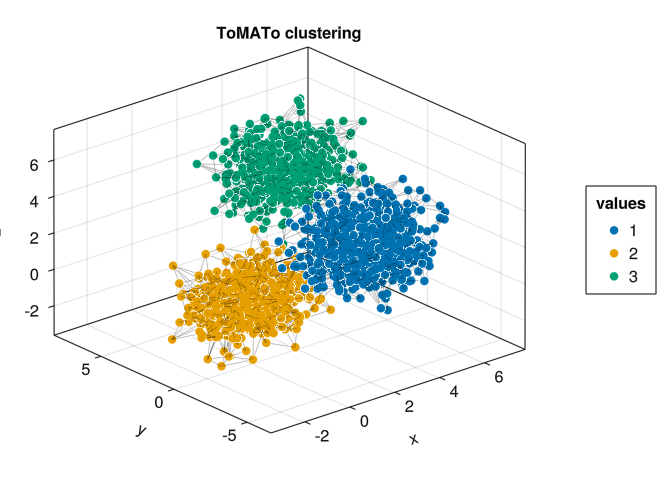
Three normals in \(\mathbb{R}^3\)
X = hcat(randn(3, 800), randn(3, 800) .+ 4, randn(3, 1000) .+ (3, -3, 3))
k = x -> exp(-(x / 2)^2)
ds = gd.Filters.density(X, kernel_function = X -> X .|> k |> sum)

axis = (type = Axis3, width = 600, height = 600)
df = (x1 = X[1, :], x2 = X[2, :], x3 = X[3, :], ds = ds)
plt = data(df) * mapping(:x1, :x2, :x3, color = :ds)
draw(plt, axis = axis)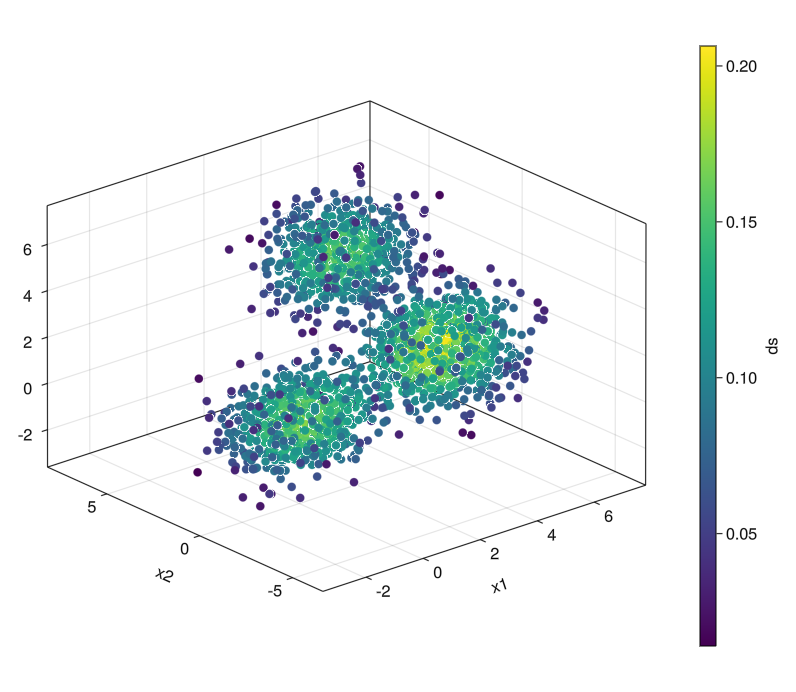
g = proximity_graph(X, 0.2, max_k_ball = 10, k_nn = 5, min_k_ball = 5)

fig, ax, plt = graph_plot(X, g, ds)
fig
┌ Warning: Axis got passed, but also axis attributes. Ignoring axis attributes (type = Axis3, width = 600, height = 600).
└ @ AlgebraOfGraphics ~/.julia/packages/AlgebraOfGraphics/yhdjr/src/draw.jl:19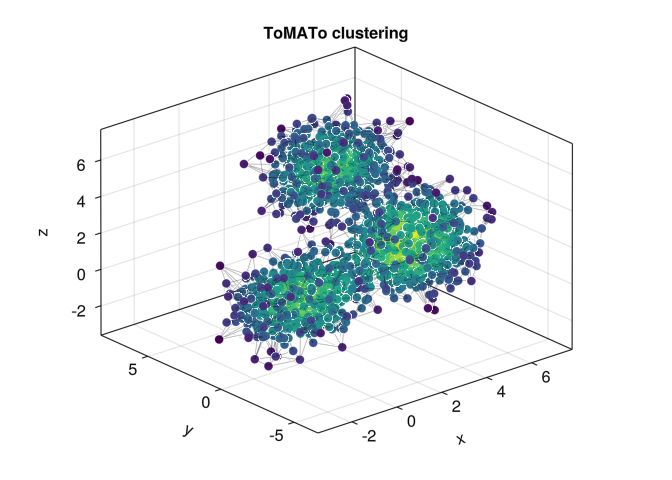
_, births_and_deaths = tomato(X, g, ds, Inf)
plot_births_and_deaths(births_and_deaths)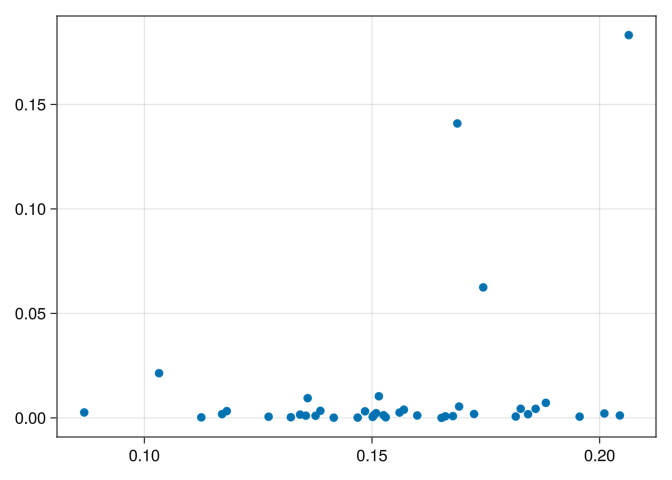
τ = 0.05
clusters, _ = tomato(X, g, ds, τ, max_cluster_height = τ)

fig, ax, plt = graph_plot(X, g, clusters .|> string)
fig
┌ Warning: Axis got passed, but also axis attributes. Ignoring axis attributes (type = Axis3, width = 600, height = 600).
└ @ AlgebraOfGraphics ~/.julia/packages/AlgebraOfGraphics/yhdjr/src/draw.jl:19